From one sentence to a shipped dashboard
The demo always goes well. Then comes the only question that actually matters — can we put this in front of people? This is the story of one small internal tool answering that question: a dashboard of overdue invoices by account, taken from a single sentence to a live, governed page. We are writing it down because the interesting part is not the dashboard. It is everything in the gap between describe it and ship it, and which parts OBTO carries for you versus which parts stay yours.
The ask
"A dashboard of overdue invoices by account." That is the whole brief — one sentence, the way a finance lead would actually say it in a hallway. No spec, no wireframe, no ticket.
What came back
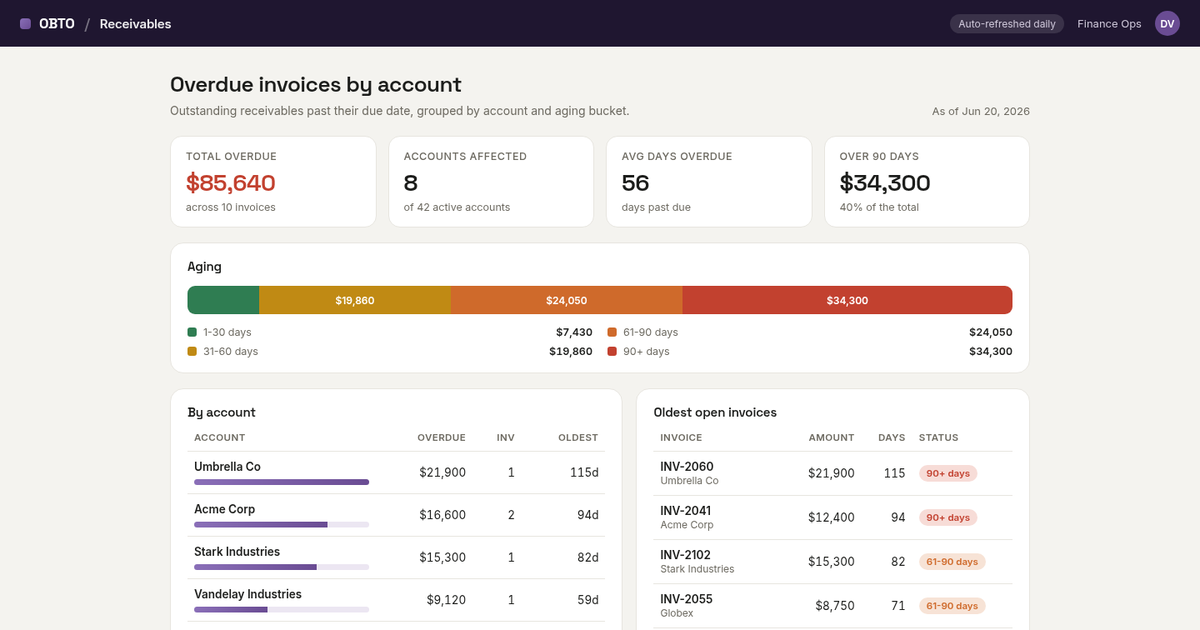
Not a mockup — a real page at a real URL, branded and laid out the way you would expect an internal Receivables view to look:
- Four KPIs up top — total overdue, accounts affected, average days overdue, and the number that actually worries a CFO: the balance over 90 days.
- An aging bar (1-30 / 31-60 / 61-90 / 90+ days), so you can see the shape of the risk, not just the total.
- A "by account" table, sorted by exposure, each row with a small bar so the worst offenders jump out.
- An "oldest open invoices" table, for when someone eventually has to chase a specific invoice number.
It looks finished. That is exactly the part that is easy now. The interesting part is everything holding it up.
What's underneath (the part that makes it not a screenshot)
A demo of this is trivial. A shippable version is not — and the difference is the stack underneath, which on OBTO came standard rather than as a six-month project:
- It is a versioned record, not a file on a server. The page is an artifact with history. Changing it is a diff you can roll back — so versioning and rollback are not a separate system you bolt on; they are how the platform already stores the thing.
- It is served at a governed URL. No deploy pipeline to assemble, no box to keep alive. It built in a few seconds and it was live on the domain.
- Every number traces to a logged call. The footer is not decoration: every figure on the page can trace to a logged tool call — a Glass Receipt that records who asked, what query ran, and what came back. That one mechanism is most of observability and most of an audit trail, by default. When finance asks where a number came from, there is an answer, not a shrug.
- Auth lives at the boundary. Who is allowed to load the view is enforced server-side, below the interface, so it holds no matter which client calls in.
What's honestly still yours
The page ships with sample data — and the footer says so, on purpose. We are not going to pretend a sentence wired itself into your accounting system. The remaining work is the work that was always going to be yours:
- Point it at your real receivables. Swap the sample rows for a tool call against your actual invoice data. The layout does not change; the source does.
- Decide who sees it. Finance Ops only? The whole leadership team? That is a permission, set once.
- Decide the rules. What counts as overdue for your business, when dunning kicks in, which accounts are exempt. Judgment calls a model should not make for you.
A note on what you are seeing in these screenshots: the figures are redacted, but the pages are from real, running OBTO apps — not staged mockups.
The takeaway
The visible dashboard — the ten percent you can screenshot — took one sentence. The reason it is a shippable tool and not a pretty picture is that the other ninety percent came standard: a versioned artifact, a served URL, traceable data, server-side auth. That is the whole pitch in one small build. Describe the internal tool, get the governed tool — then spend your time on the parts that actually need you.
If you want to see it, the live dashboard is here, getting started puts a governed tool and a real receipt in front of you in minutes, and pricing starts at zero. It is the same thesis behind why a prototype that feels like a product still isn't one.
Frequently asked questions
How long did the overdue-invoices dashboard take to build?
The visible page came from a single sentence and built in seconds. The point of this piece is that the dashboard is the easy part — what makes it shippable is the stack underneath (versioning, hosting, traceable data, server-side auth), which on OBTO comes standard rather than as a separate project.
Is the dashboard using real data?
The published page shows sample, redacted figures — it says so in the footer. The page itself is a real, running OBTO app; wiring it to your actual receivables data is a tool call you add, and the layout does not change.
What is a Glass Receipt?
A Glass Receipt is OBTO's per-call record of who ran what, against which record, with what result. Because every figure on a page can trace to one, it gives you most of observability and most of an audit trail by default — so when someone asks where a number came from, there is an answer.
What do I still have to do myself?
You bring the real data, the permissions (who can see it), and the business rules (what counts as overdue, who is exempt, who approves a write). OBTO removes the work of assembling the production stack underneath them; it does not make those judgment calls for you.